> ## Documentation Index
> Fetch the complete documentation index at: https://bruno-a6972042-docs-timeline-scripts.mintlify.site/llms.txt
> Use this file to discover all available pages before exploring further.
# Response Visualization
Bruno provides a powerful visualization feature that allows you to display API response data in a more readable and interactive format using the `bru.visualize` function.
```javascript theme={null}
bru.visualize(type, config)
```
1. **type**: The type of visualization to render (e.g., 'table', 'html').
2. **config**: A configuration object that includes:
* **name**: The name of the visualization instance.
* **provider**: The rendering library or provider used to display the visualization (e.g., 'ag-grid', 'react-table').
* **props**: Additional properties required by the provider to configure the visualization.
## Supported Visualization Types and Providers
### Table Visualization ('table')
You can render tables using different providers like `ag-grid` and `react-table`.
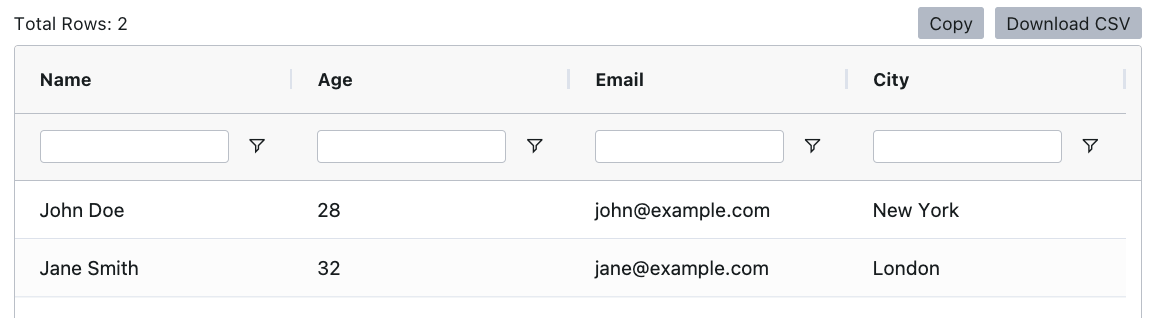
#### Using **ag-grid**
*Example:*
 ```javascript theme={null}
const rowData = [
{ name: 'John Doe', age: 28, email: 'john@example.com', city: 'New York' },
{ name: 'Jane Smith', age: 32, email: 'jane@example.com', city: 'London' }
];
const columnDefinitions = [
{ field: "name", filter: true, floatingFilter: true },
{ field: "age", filter: true, floatingFilter: true },
{ field: "email", filter: true, floatingFilter: true },
{ field: "city", filter: true, floatingFilter: true }
];
bru.visualize('table', {
name: 'table1',
provider: 'ag-grid',
props: { rowData, columnDefinitions }
});
```
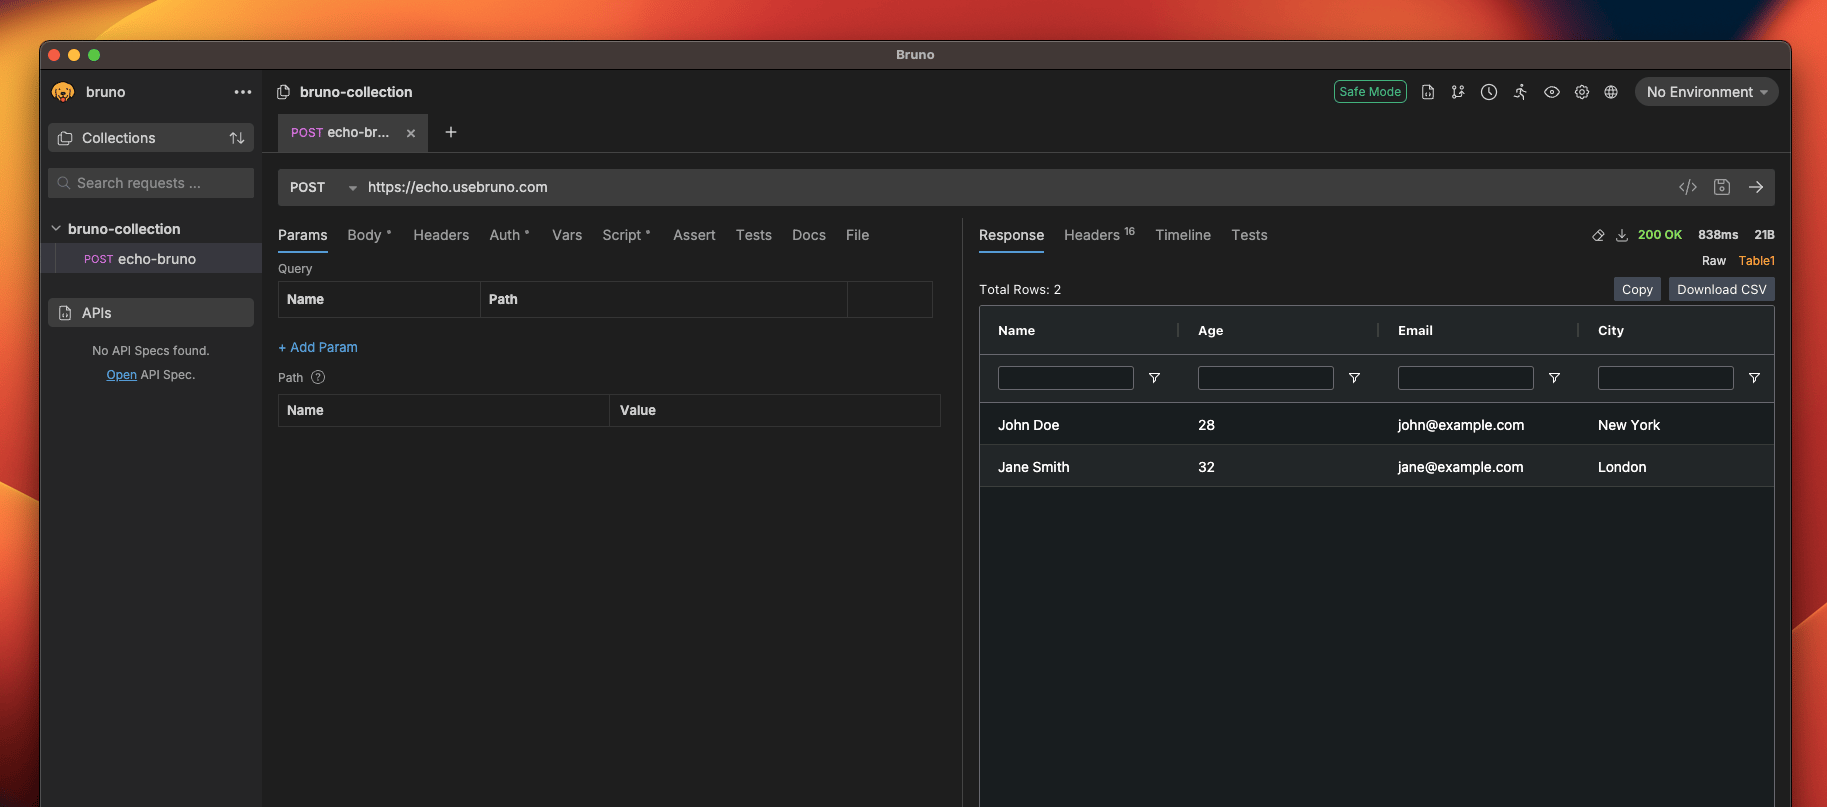
This will render a table using the ag-grid provider with filters enabled on all columns.
#### Using **react-table**
*Example:*
```javascript theme={null}
const rowData = [
{ name: 'John Doe', age: 28, email: 'john@example.com', city: 'New York' },
{ name: 'Jane Smith', age: 32, email: 'jane@example.com', city: 'London' }
];
const columnDefinitions = [
{ field: "name", filter: true, floatingFilter: true },
{ field: "age", filter: true, floatingFilter: true },
{ field: "email", filter: true, floatingFilter: true },
{ field: "city", filter: true, floatingFilter: true }
];
bru.visualize('table', {
name: 'table1',
provider: 'ag-grid',
props: { rowData, columnDefinitions }
});
```
This will render a table using the ag-grid provider with filters enabled on all columns.
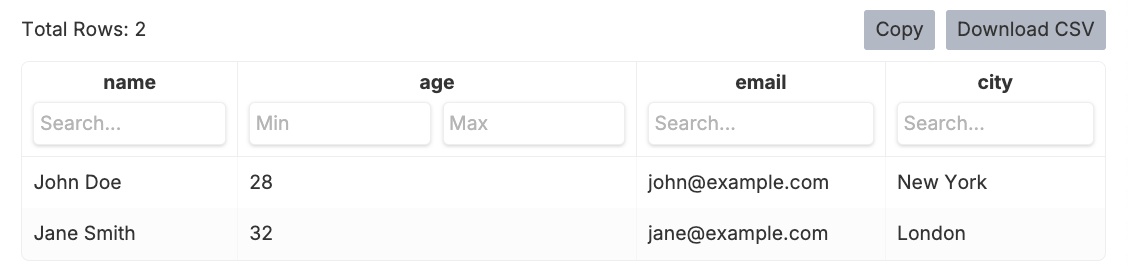
#### Using **react-table**
*Example:*
 ```javascript theme={null}
const rowData1 = Array.from({ length: 2500 })
.map((_) => [
{ firstName: 'Tanner', lastName: 'Linsley', age: 24, visits: 100 },
{ firstName: 'Tandy', lastName: 'Miller', age: 40, visits: 40 },
{ firstName: 'Joe', lastName: 'Dirte', age: 45, visits: 20 },
]).flat();
const columnDefinitions1 = [
{
id: "firstName",
cell: (info) => info.getValue(),
header: () => `First Name`,
meta: { filterVariant: "text" },
},
{
id: "lastName",
cell: (info) => info.getValue(),
header: () => `Last Name`,
meta: { filterVariant: "text" },
},
// Additional column definitions here...
];
bru.visualize('table', {
name: 'table2',
provider: 'react-table',
props: { rowData: rowData1, columnDefinitions: columnDefinitions1 }
});
```
This example renders a large table using the react-table provider, with custom headers and filter variants.
### HTML Visualization ('html')
You can also render custom HTML content using the html type. This allows for advanced templating and formatting, such as generating a data table or a report.
#### Using **HTML** String
*Example:*
```javascript theme={null}
const rowData1 = Array.from({ length: 2500 })
.map((_) => [
{ firstName: 'Tanner', lastName: 'Linsley', age: 24, visits: 100 },
{ firstName: 'Tandy', lastName: 'Miller', age: 40, visits: 40 },
{ firstName: 'Joe', lastName: 'Dirte', age: 45, visits: 20 },
]).flat();
const columnDefinitions1 = [
{
id: "firstName",
cell: (info) => info.getValue(),
header: () => `First Name`,
meta: { filterVariant: "text" },
},
{
id: "lastName",
cell: (info) => info.getValue(),
header: () => `Last Name`,
meta: { filterVariant: "text" },
},
// Additional column definitions here...
];
bru.visualize('table', {
name: 'table2',
provider: 'react-table',
props: { rowData: rowData1, columnDefinitions: columnDefinitions1 }
});
```
This example renders a large table using the react-table provider, with custom headers and filter variants.
### HTML Visualization ('html')
You can also render custom HTML content using the html type. This allows for advanced templating and formatting, such as generating a data table or a report.
#### Using **HTML** String
*Example:*
 ```javascript theme={null}
const htmlString = `
```javascript theme={null}
const htmlString = `
| Name | Age | Email | City |
|---|
| John Doe | 28 | john@example.com | New York |
| Jane Smith | 32 | jane@example.com | London |
`;
bru.visualize('html', {
name: 'htmlReport',
content: htmlString
});
```
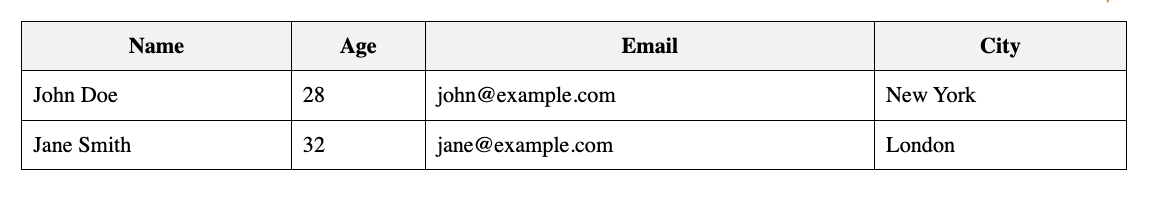
This example will render an HTML table with predefined data using the html type.
## Viewing Your Visualization
1. Add the visualization code to your request's script section
2. Execute the request
3. Click on the **Table** option (next to Raw)
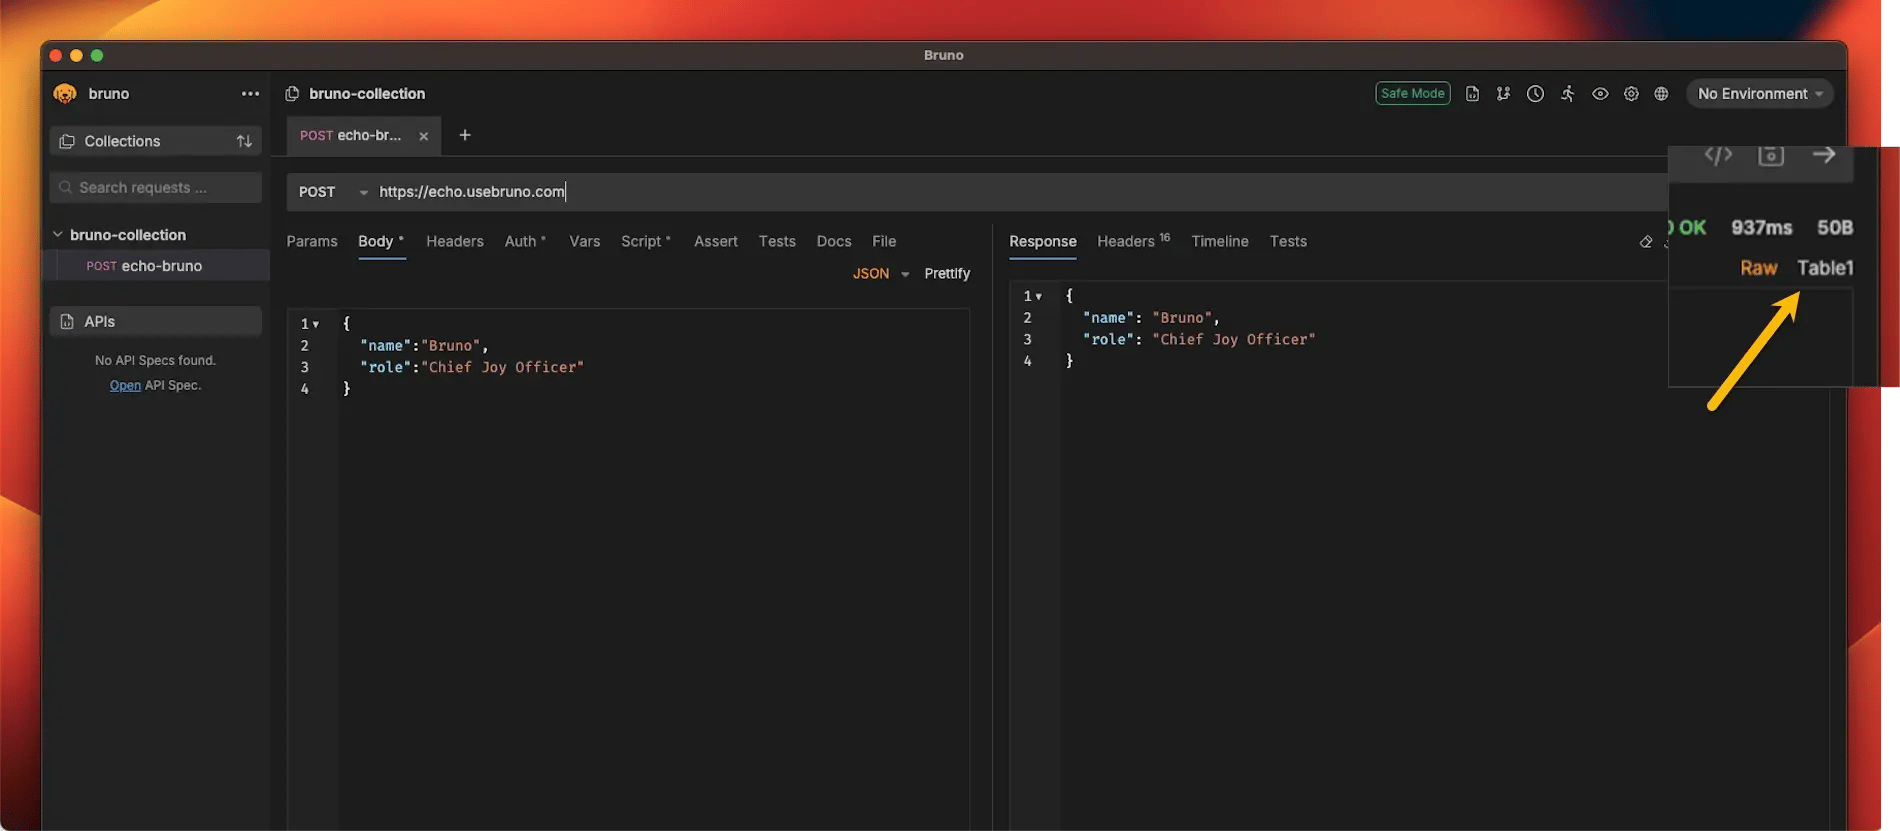 4. Your visualization will be displayed in the panel
 ### Parameters
| Name | Type | Description |
| -------- | -------- | ------------------------------------------------------------------------------- |
| `type` | `string` | The type of visualization to render. Supported values: `'table'`, `'html'`. |
| `config` | `object` | Configuration object for the visualization. See below for available properties. |
### Config Properties
| Property | Type | Description |
| ---------- | -------- | -------------------------------------------------------------------------------------------------- |
| `name` | `string` | Name of the visualization instance. |
| `provider` | `string` | The provider or rendering engine to use for the visualization. E.g., `'ag-grid'`, `'react-table'`. |
| `props` | `object` | Additional properties required by the provider to configure the visualization. |
| `content` | `string` | (For `html` type only) The HTML content to render. |
### Parameters
| Name | Type | Description |
| -------- | -------- | ------------------------------------------------------------------------------- |
| `type` | `string` | The type of visualization to render. Supported values: `'table'`, `'html'`. |
| `config` | `object` | Configuration object for the visualization. See below for available properties. |
### Config Properties
| Property | Type | Description |
| ---------- | -------- | -------------------------------------------------------------------------------------------------- |
| `name` | `string` | Name of the visualization instance. |
| `provider` | `string` | The provider or rendering engine to use for the visualization. E.g., `'ag-grid'`, `'react-table'`. |
| `props` | `object` | Additional properties required by the provider to configure the visualization. |
| `content` | `string` | (For `html` type only) The HTML content to render. |